How high will mortgage rates climb in the next 36 months?

NEW -> Contingent Buyer Assistance Program
I love garage laundry. My old woodbury home has it and i loved it. We didnt have to worry about the noises since we usually did laundry at night. My current IP home has it on 2nd floor. Not my cup of tea.
I agree with you. My old home in Eastvale has the laundry room right at the entrance from the garage before getting into the house. Didn't have to worry about noise since we also used to do laundry at night. Right now, the laundry is right next to my son's room. We now do laundry on Saturday morning and my son is still sleeping. He does use some white noise effect from the iPad, but I don't know if it's able to block the noise from the laundry.
 
That is correct. You take the basis of the "exit" property and then you add the difference of the sales price of the "move up" property minus the sales price of the "exit" property. So in your example, the basis would be $700k + $500k = $1.2m and the property tax on the "move up" home would be $7k + $5k (1% of the $500k) for a total of $12k per year. Prop 19 always you to do this 3 times in a lifetime and can be from any properties in CA.
Damn...I'm a few years away from 55. Otherwise, I could have used this Prop 19 twice when I moved from my Eastvale home to Bluffs and then from Bluffs to Cielo. :cry:
 
Mortgage rates hit a new high for the year. I can almost feel that sweet, sweet inventory disappearing before our eyes.

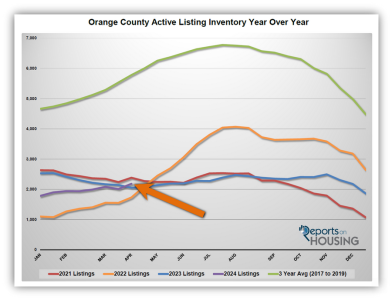
1714065845677.png

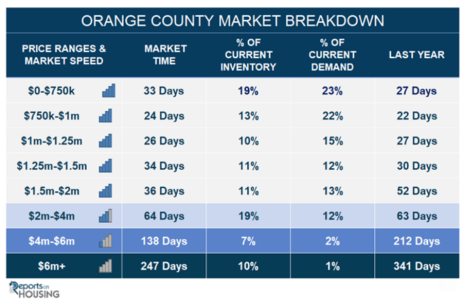
1714065889903.png

But wait a second... What's this I see? Inventory is actually higher than last year and so is market time for homes under $4M.

1714066285848.png
1714066400789.png

Well, never mind all these silly numbers... If you can afford it (and who can?) it's always a great time to buy!!
 
Well, never mind all these silly numbers... If you can afford it (and who can?) it's always a great time to buy!!
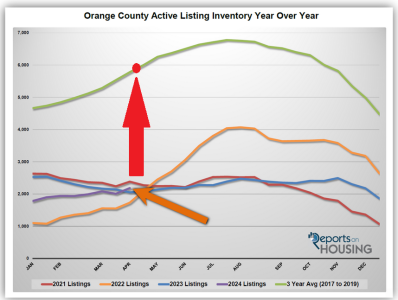
You own chart betrays you... current inventory is still less than half of what it was in your chart's 3 year average:

1714072820701.png

You should really learn to read a chart.
 
No... I said higher rates after a low rate era will not result in high inventory. Stop making stuff up.

And that's the point 2017-2019 rates were lower than now... but where was inventory?

Stop burying yourself.
 
No... I said higher rates after a low rate era will not result in high inventory. Stop making stuff up.

And that's the point 2017-2019 rates were lower than now... but where was inventory?

Stop burying yourself.
If that's what you said, then you got it completely wrong. Inventory has already doubled off the recent lows even as rates more than tripled.
 
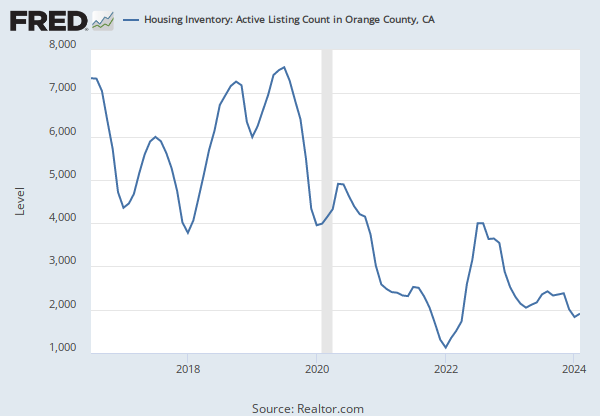
active inventory listings OC. Here is an easier chart than that multi colored confusion above.

fredgraph.png


On a practical note. dafuq is this shit?
1714072820701-png.9727
 
Last edited:
A similar one for the US was posted.

Shows the same trend, during non-Covid times, when rates were sub 5%, Inventory was average 5-6k. During Covid, it dropped and then in 2022 when rates rose, once they stabilized at higher interest (because you can still get jumbos cheap), inventory tapered off and if you can read the chart... current inventory levels are less than half of what they were prior to 2020.

But never mind those silly numbers... according to someone, higher rates are going to push inventory back up to 7k.

And just to be clear... I did not say higher rates will push inventory lower... I said inventory will probably reman at low levels compared to when we had lower rates pre-Covid because logically... anyone locked in to low rate will not want to sell and rebuy at higher prices and higher rates.
 
active inventory listings OC. Here is an easier chart than that multi colored confusion above.

fredgraph.png


On a practical note. dafuq is this shit?
1714072820701-png.9727


Steven Thomas's data is often more junk than science. How 2017-2019 compares to our market 5 years later is incomprehensible. If anything a 2020-2023 average would be more appropriate.
 
Steven Thomas's data is often more junk than science. How 2017-2019 compares to our market 5 years later is incomprehensible. If anything a 2020-2023 average would be more appropriate.

Orange County inventory levels have been hovering around 2,800 for a past few months which is lower than every month in 2023 except for December 2023. You can see inventory is only 30-40% of the levels in 2019.
 

Attachments

  • Orange County 5 year Inventory.png
    Orange County 5 year Inventory.png
    29.6 KB · Views: 9
Orange County inventory levels have been hovering around 2,800 for a past few months which is lower than every month in 2023 except for December 2023. You can see inventory is only 30-40% of the levels in 2019.
That’s basically 1 listing per 1.1 million OC residents, not counting outsiders looking to buy.
 
That’s basically 1 listing per 1.1 million OC residents, not counting outsiders looking to buy.

I know that I sound like a break record but pricing is heavily influenced by the supply of homes on the market. Interest rates are only one component that can influence the demand side but the numbers of homes on the market is the big driver as it is the supply side. Until inventory increases materially prices won't material drop.
 
Back
Top